
Retired Techie
Getting older, not necessarily wiser!
Conky System Monitor Part 3
Published on December 22, 2022 at 5:01 pm by LEWIntroduction
In this post I will be walking though actually making a conky display. I will be including the actual configuration file for this display as an attachment, as the conky.conf file can take a fair number of lines.
If you want, you can download the file and follow along. The purpose here is not to design an epic display, but to demonstrate what can be done in a relatively short time with conky.
The Display
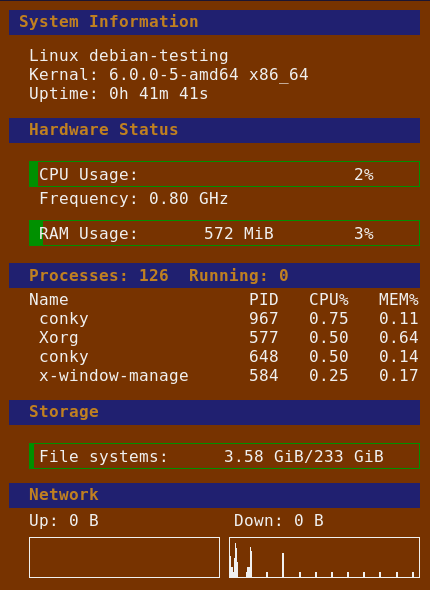
This is what the display I am making will look like once finished. Be sure to be careful with your line returns as they will show up in the final output.
System Information
Starting at the top, we use the following code in the conky.text = [[…]] section to set up the top break for the System Information section.
${color5}${hr 25}
${voffset -17}${color6}${font1} System Information${color1}${font}
On the first line we draw a horizontal rule (hr) of height 25. Color 5 was preset in the conky.conf = {{…}} section of the file (color5 = ‘227’,). A return and we start the second line with a vertical offset (voffset) of -17, which moves objects upwards. This moves the text up over the horizontal rule. The color/font is again set using predefined values (color6 = ‘c82’, and font1 = ‘DejaVu Sans Mono:Bold:size=12’,) from tbhe conky.config = {{…}} section. Afterward the text we setup the font and color for the next line (again predefined ).
Note that voffset, as far as I can tell, is not an exact science. You will have to try a number, and if the offset is not correct, modify the number and re-display.
Moving down, we apply a bit of voffset, and some conky system variables for various pieces of information.
${voffset 15}  $sysname $nodename
 Kernal: $kernel $machine
 Uptime:$color $uptime
Note that you can find these variables in the conky variable list (part of what makes it so long).
Hardware Status
The section break for hardware status works the same way as the above section. What is different here is that we are placing our text over some percent usage bars. This works similar to the above, except we are not using the Horizontal rule.
${voffset 15}  ${color3}${cpubar 25}
${voffset -33}${color1}${goto 35}CPU Usage:${goto 350}$cpu%
In this case we use the cpu bar with a height of 25, and another predefined color. Note the spaces at the beginning, this moves the bar in a little. In the second line we use ${goto} to position the text horizontally. Like ${voffset}, the value is in pixels. So you may have to make some minor adjustments to get items positioned exactly where you want them to go. We are also using ${cpu%} to get a numeric value for CPU usage.
RAM usage works the same way.
Note there is another command for horizontal movement called ${offset}. The ${offset} command moves an item fro9m the last cursor position, whereas ${goto} uses the far left (0) to move from.
Also note that if there are no spaces in a command, then you do not have to use the { and }, they are optional. If there are spaces then you will be required to use them.
Processes
The difference here is that we are using commands within the section header, sort of like the CPU and RAM from above (Note the second and third lines are actually one line, but may show up as two depending on the size of your view window).
${voffset 20}${color5}${hr 25}${color1}
${voffset -16}${color6}${font1}  Processes: $processes  Running: $running_processes
Note that the alignment id done in this section with spaces. At some point this may become problematic based on the names of the processes. We could use ${goto}, the only down side being muddying up the readability of the lines in the code.
Storage
The Storage section is similar to what we have done above. Because there is nothing really new, I ma not going to cover it here.
Network
In the network section we add a couple of graphs for uploads and downloads. In these objects we specify the network interface, the height, and the width of each graph.
${upspeedgraph eno1 40,190} ${downspeedgraph eno1 40,190}
We prepend a few spaces to adjust the positioning. For each graph we define the interface, the height, and the width. There are several additional items that can be defined, two gradient colors, and scale.
Conclusion
In this post we put together a rather simple coky display using basic commands. However there is much more that conky is capable of.It is well worth it to at least browse the available online documentation. There are also lots of sample scripts out there to reference.
Conky System Monitor Part 3
Add New Comment